This insightful article from CoBank in Minneapolis, Minnesota was written by Jacqui Fatka. Jacqui Fatka is a Lead Economist in Farm Supply and Biofuel for CoBank and is the original author of the article.
Commodity prices falling faster than input costs have pushed many farmers to seek additional financing this growing season, resulting in higher operating loans. Farmers’ real estate debt remained robust, but many have used appreciating farmland as collateral to help weather the lower commodity price environment.
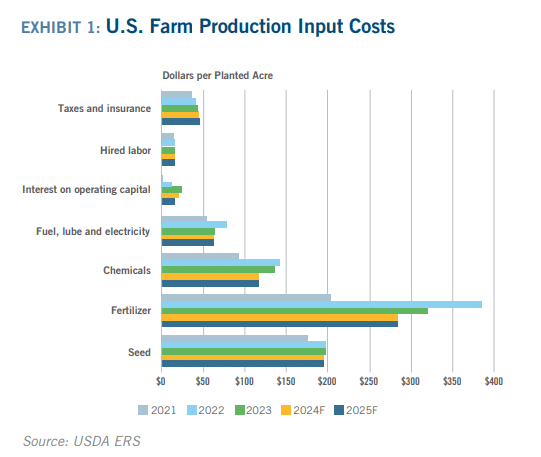
In June, USDA forecast that production costs would remain relatively stable in 2024 and 2025. Fertilizer and chemical costs have seen the greatest reductions from the highs set in 2022, while seed costs have remained steady (Exhibit 1). USDA anticipates minimal changes in 2024 and 2025 production costs. Farmers will make most 2024 input purchases after the growing season but will prepurchase some chemicals and fertilizers this summer for the 2025 growing season.
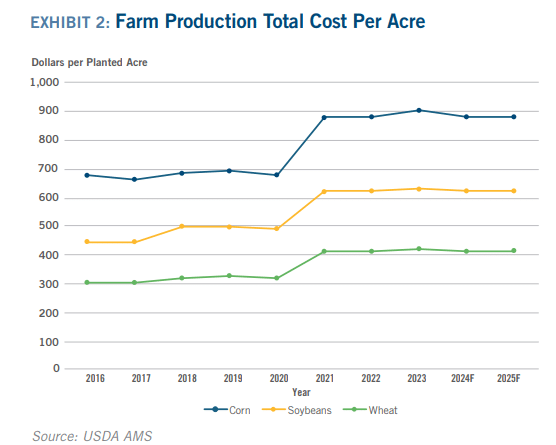
Farm production costs have stayed relatively flat over the last four years (Exhibit 2), while prices have dropped considerably since 2022. Fertilizer is the largest component for corn production, varying between 40% and 55% through time, and estimated at nearly 40% for 2024. Seed cost share on corn acres has averaged around 30%, and the pesticide cost share declined from around 28% in 2000 to 15% in 2012 but has since increased back to nearly 30%, the University of Illinois reports. Going forward, sustained high fertilizer prices compared to lower new crop corn values may push some farmers to delay fall application until winter/spring. If this is widespread, logistics could struggle to get product where it is needed.
- Farmers entered the 2024 growing season with higher financing needs to cover increased input costs.
- Fertilizer and chemical costs came down from the highs set in 2022 while seed prices remained flat.
- Sustained fertilizer prices are keeping corn production costs high in a difficult commodity price environment.


Disclaimer: The information provided in this report is not intended to be investment, tax, or legal advice and should not be relied upon by recipients for such purposes. The information contained in this report has been compiled from what CoBank regards as reliable sources. However, CoBank does not make any representation or warranty regarding the content, and disclaims any responsibility for the information, materials, third party opinions, and data included in this report. In no event will CoBank be liable for any decision made or actions taken by any person or persons relying on the information contained in this report.
